Image Details
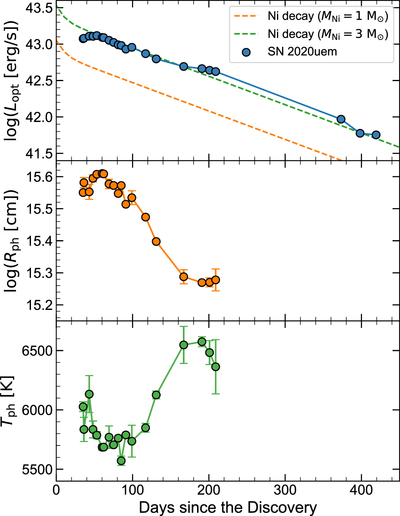
Caption: Figure 3.
Top: quasi-bolometric (B to I or g to i band) light curve of SN 2020uem. The orange and green dashed lines show light curves powered by the radioactive decay of 1 M ⊙ and 3 M ⊙ of 56Ni , respectively. Middle: time evolution of the photospheric radius estimated by SED fitting. Bottom: time evolution of the photospheric temperature.
Other Images in This Article

Show More
Copyright and Terms & Conditions
© 2023. The Author(s). Published by the American Astronomical Society.
Copyright ©
2025 Astronomy Image Explorer. All Rights Reserved.