Image Details
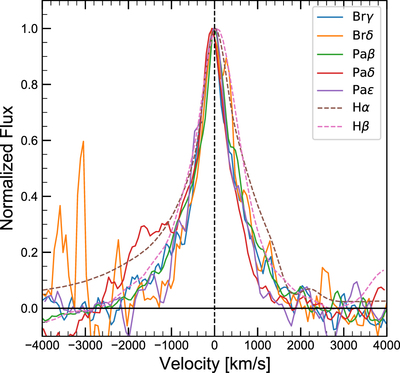
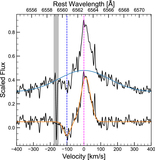
Caption: Figure 9.
Comparison of the line profiles, shown for Brγ (blue), Brδ (orange), Paβ (green), Paδ (red), and Paε (purple). For comparison, we also plot Hα and Hβ obtained at t = +103 days with FOCAS. Each profile is normalized by its peak flux. The vertical dashed line shows the rest wavelength, i.e., v = 0 km s−1, and the horizontal line shows the zero flux level.
Other Images in This Article

Show More
Copyright and Terms & Conditions
© 2023. The Author(s). Published by the American Astronomical Society.
Copyright ©
2025 Astronomy Image Explorer. All Rights Reserved.