Image Details
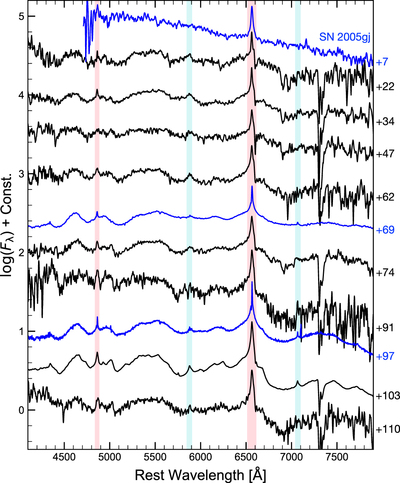
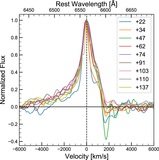
Caption: Figure 5.
Spectral evolution of SN 2020uem (black lines) extending from +22 days to +110 days after discovery. The epoch for each spectrum is shown on the right side. All spectra are corrected to rest wavelengths with the redshift z = 0.041. The red shaded regions are the wavelengths of Hα and Hβ. The blue shaded regions are the wavelengths of He I λ5876 and He I λ7065. For comparison, we plot the spectra of an SN IIn/Ia-CSM, SN 2005gj (Aldering et al. 2006; Silverman et al. 2012, 2013b), with blue lines.
Other Images in This Article

Show More
Copyright and Terms & Conditions
© 2023. The Author(s). Published by the American Astronomical Society.
Copyright ©
2025 Astronomy Image Explorer. All Rights Reserved.