Image Details
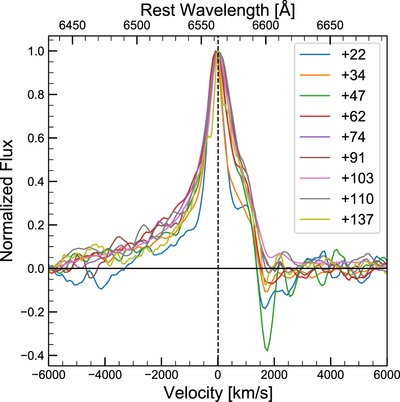
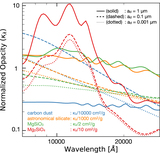
Caption: Figure 6.
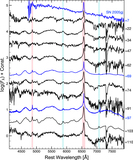
Time evolution of the Hα profile, plotted in velocity space. We also show the rest wavelength in the top axis. The spectra are scaled by the maximum flux of Hα and the continuum is already subtracted. The absorption at v ≈ 2000 km s−1 of low-quality spectra may be due to oversubtraction of a nitrogen sky emission line.
Other Images in This Article

Show More
Copyright and Terms & Conditions
© 2023. The Author(s). Published by the American Astronomical Society.
Copyright ©
2025 Astronomy Image Explorer. All Rights Reserved.