Image Details
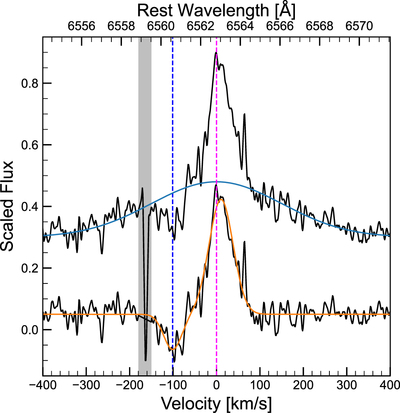
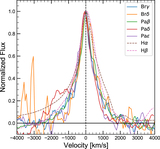
Caption: Figure 7.
A high-dispersion spectrum of top of the narrow Hα profile, plotted in velocity space and with an arbitrary flux scale. We also show the rest wavelength in the top axis. The upper black spectrum shows a non-continuum-subtracted spectrum, while the lower black spectrum is a continuum-subtracted spectrum. The blue solid line shows an underlying broad component fit by a single Gaussian function. The solid orange line shows the double Gaussian components fit to the narrow P-Cygni component. The magenta vertical dashed line shows the rest wavelength of Hα (6562.8 Å). The cyan vertical dashed line shows a blueshift of −100 km s−1 from the rest wavelength, which corresponds to the absorption minimum of the P-Cygni profile. The apparent absorption at v ≈ −160 km s−1, which is shaded in gray, is an artifact, caused by bad pixels.
Other Images in This Article

Show More
Copyright and Terms & Conditions
© 2023. The Author(s). Published by the American Astronomical Society.