Image Details
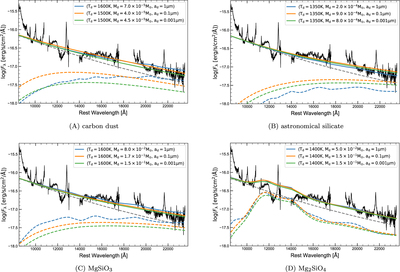
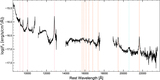
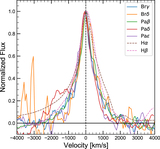
Caption: Figure 11.
The observed spectrum as compared to the dust emission models for (A) carbon dust, (B) astronomical silicate, (C) MgSiO3, and (D) Mg2SiO4. The gray dashed line shows blackbody radiation with a temperature of 6500 K from the SN. The blue, orange, and green dashed lines show the dust thermal emission (F ν,dust). The solid lines show the total flux of the dust emission model (F ν,tot). The parameter sets of the dust properties (dust temperature, mass, and size) are shown in the legends.
Other Images in This Article

Show More
Copyright and Terms & Conditions
© 2023. The Author(s). Published by the American Astronomical Society.
Copyright ©
2025 Astronomy Image Explorer. All Rights Reserved.