Image Details
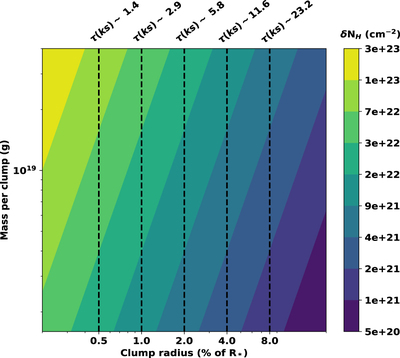
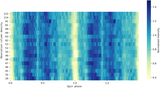
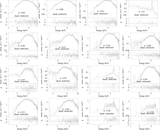
Caption: Figure 11.
The coherence timescale τ of the column density time series is represented in kiloseconds at the top, and the color map shows the standard deviation δ N H for different clump sizes and masses. The values of orbital separation, orbital inclination, eccentricity, longitude of periastron, and periastron angle are taken from Jenke et al. (2012), and the orbital phase of the pulsar is 0.25.
Other Images in This Article
Show More
Copyright and Terms & Conditions
© 2023. The Author(s). Published by the American Astronomical Society.
Copyright ©
2025 Astronomy Image Explorer. All Rights Reserved.