Image Details
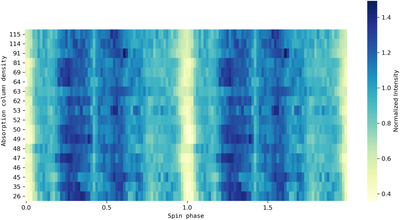
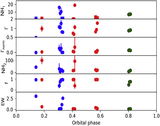
Caption: Figure 5.
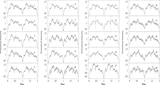
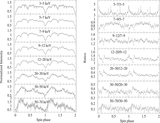
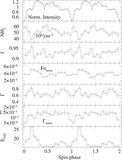
Pulse profiles of OAO 1657–415 for HR-resolved segments in order of increasing absorption column density (units of 1022 cm−2) marked along the Y-axis from bottom to top and spin phase marked along the X-axis. The color maps represent the pulse normalized intensity.
Other Images in This Article
Show More
Copyright and Terms & Conditions
© 2023. The Author(s). Published by the American Astronomical Society.
Copyright ©
2025 Astronomy Image Explorer. All Rights Reserved.