Image Details
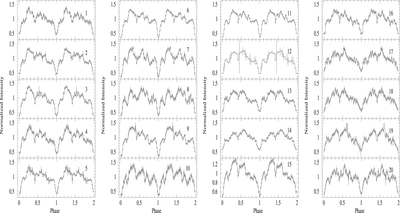
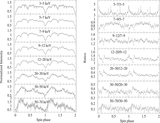
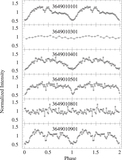
Caption: Figure 4.
Pulse profiles over each time segment of constant HR (see panel in Figure 3). Time segments are indicated in the upper right corner inside all panels. The Y-axis is the normalized counts per second with respect to the average for each plot.
Other Images in This Article
Show More
Copyright and Terms & Conditions
© 2023. The Author(s). Published by the American Astronomical Society.
Copyright ©
2025 Astronomy Image Explorer. All Rights Reserved.