Image Details
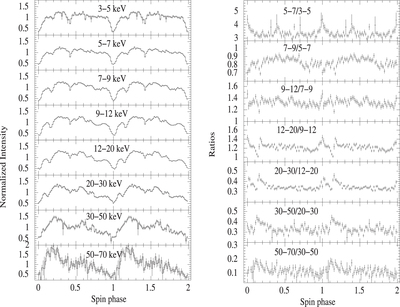
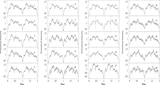
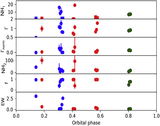
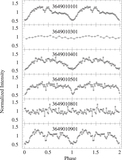
Caption: Figure 6.
Left: energy-resolved pulse profiles for FPMA+B light curves, where a dip at ∼0.15 is clearly seen. Right: ratio of pulse profiles with energy denoted inside the panel.
Other Images in This Article
Show More
Copyright and Terms & Conditions
© 2023. The Author(s). Published by the American Astronomical Society.
Copyright ©
2025 Astronomy Image Explorer. All Rights Reserved.