Image Details
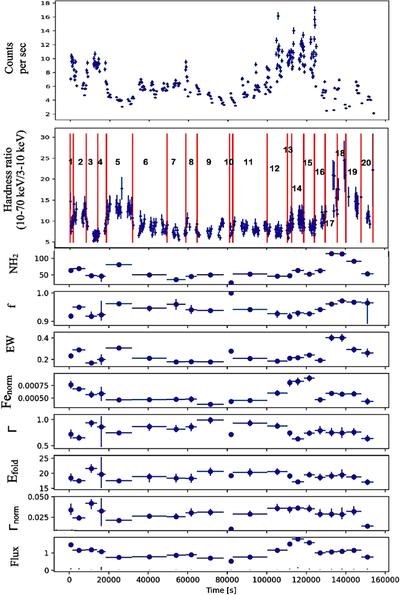
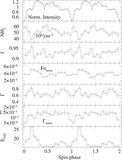
Caption: Figure 3.
From top to bottom are the NuSTAR light curves (counts per second), HR with 20 time segments delimited by red vertical solid lines, absorption column density NH2 (in units of 1022 cm−2), covering fraction f, EW (in keV), normalization of the Fe Kα line Fenorm (in photons cm−2 s−1), spectral index Γ, folding energy E fold (in keV), normalization of the power law Γnorm (in photons keV−1 cm−2 s−1 at 1 keV), and absorbed flux in 3–70 keV (in 1 × 10⁻⁹ erg cm−2 s−1). The NH1 is frozen at the line-of-sight absorption of 1.8 × 10²² atoms cm−2. Note that not all parameters could be constrained in segment 10; therefore, no errors are plotted for this segment. The corner plots corresponding to some segments where the absorption values are medium, low, and high (1, 7, and 19) in these fits are shown in Figures A2–A4.
Other Images in This Article
Show More
Copyright and Terms & Conditions
© 2023. The Author(s). Published by the American Astronomical Society.