Image Details
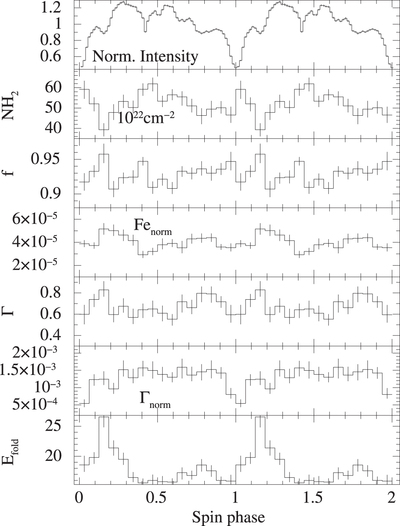
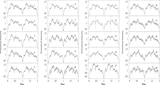
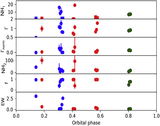
Caption: Figure 7.
Spin phase–resolved NuSTAR spectroscopy of OAO 1657–415 for 16 phase bins. From top to bottom are the normalized intensity of the pulse profiles, absorption column density NH2 (in units of 1022 cm−2), covering fraction f, Fe Kα normalization (Fenorm; in photons cm−2 s−1), spectral index Γ, normalization of the power law (Γnorm; in photons keV−1 cm−2 s−1 at 1 keV), and folding energy (E fold; in keV). The corner plots of the third, seventh, and 13th phase bins, where the absorbing column density is low, high, and medium, respectively, are shown in Figure A5, A6, and A7.
Other Images in This Article
Show More
Copyright and Terms & Conditions
© 2023. The Author(s). Published by the American Astronomical Society.