Image Details
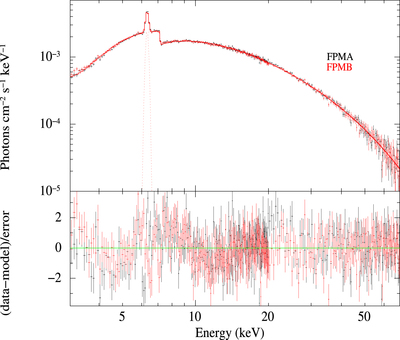
Caption: Figure 2.
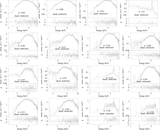
Time-averaged spectrum of OAO 1657–415 for NuSTAR FPMA (black) and FPMB (red) modeled with CUTOFFPL for orbital phase 0.612–0.743. The corner plot for the spectral parameters for the time-averaged spectrum is given in Figure A1.
Other Images in This Article
Show More
Copyright and Terms & Conditions
© 2023. The Author(s). Published by the American Astronomical Society.
Copyright ©
2025 Astronomy Image Explorer. All Rights Reserved.