Image Details

Caption: Figure 8.
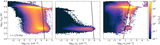
Left panel: relation of the [C II]/FIR ratio vs. ΣFIR. Low [C II]/FIR ratios are tightly connected with high SFR values. Black circles are observations presented in Herrera-Camus et al. (2018). The solid line corresponds to the Muñoz & Oh (2016) relation (Equation (6)). Right panel: relation of the [C II]/FIR ratio vs. ΣSFR. Black crosses are spatially resolved observations of the KINGFISH program presented in Smith et al. (2017), and the solid line corresponds to their best-fit function (Equation (7)). In both panels, triangles represent our simulation data, which have been color-coded according to their SFR value.
Other Images in This Article


Show More
Copyright and Terms & Conditions
© 2022. The Author(s). Published by the American Astronomical Society.