Image Details
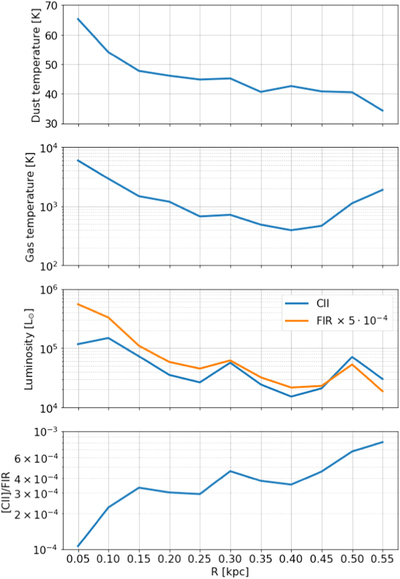
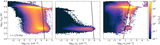
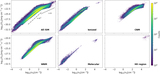
Caption: Figure 10.
Density-weighted dust temperature (top panel), density-weighted gas temperature (second panel), luminosities of [C II] and FIR (third panel), and the [C II]/FIR ratio (bottom panel) vs. the radial distance, R, from Cluster-3. Each quantity is averaged over shells of thickness 0.05 kpc. In the third panel, the FIR luminosity is displaced downward by a factor of 5 × 10⁻⁴ to ease the comparison with [C II]. For small R, both dust and gas temperatures are high, leading to high FIR and [C II] luminosities, respectively, although the emission of [C II] suffers from thermal saturation while FIR is always ﹩\propto {T}_{d}^{6}﹩. This results in a decrease of the [C II]/FIR ratio ([C II] deficit) as can be seen in the bottom panel. At larger R, the dust temperature decreases while the gas temperature remains high. This increases the [C II]/FIR ratio.
Other Images in This Article


Show More
Copyright and Terms & Conditions
© 2022. The Author(s). Published by the American Astronomical Society.