Image Details
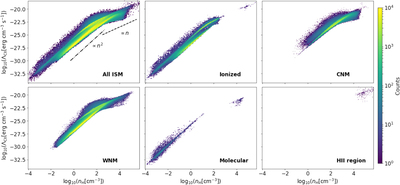
Caption: Figure 7.
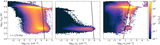
C II cooling function vs. number density for the ISM gas within 1 kpc from Cluster-3 for the t = 170 Myr snapshot (see Figure 1). The top left panel shows all contributing ISM gas. The dotted–dashed line shows the ﹩\propto {n}_{{\rm{H}}}^{2}﹩ relation, while the dashed line shows the ∝ n H relation to guide the eye. The rest of the panels show how each different ISM component (as defined in Section 4) contributes to the total ΛCII. In general, collisional de-excitation does not play an important role in the overall ΛCII function. The color-coding represents the distribution of SPH mass within the studied region.
Other Images in This Article


Show More
Copyright and Terms & Conditions
© 2022. The Author(s). Published by the American Astronomical Society.