Image Details
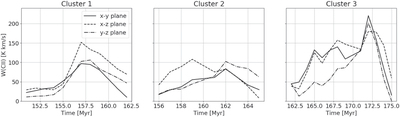
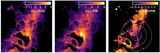
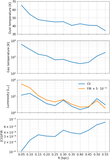
Caption: Figure 3.
Time evolution of the [C II] velocity-integrated emission for the three main clusters (left to right). The velocity-integrated emission (produced here with RADMC-3D; see Appendix A) is an average over 25 pixels (1.5 × 10³ pc2) centered on the position of each cluster. Each different line type corresponds to a different viewing angle. The solid line is for the viewing angle of Figure 1. As can be seen, there is good agreement of the [C II] trends as a function of time regardless of the viewing angle. The differences observed in each viewing angle are not arising from optical depth effects but rather due to the different projections of mass covered by the above area.
Other Images in This Article

Show More
Copyright and Terms & Conditions
© 2022. The Author(s). Published by the American Astronomical Society.