Image Details
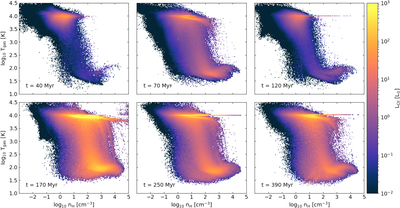
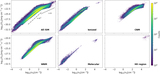
Caption: Figure 5.
Phase plots (T gas vs. total H nucleus, n H, number density) weighted with L CII for snapshots at t = 40, 70, 120, 170, 250, and 390 Myr. Before the second encounter (top row), L CII originates from the WNM (see Figure 4). Once the second encounter occurs (bottom row), H II regions form and their ionized gas takes over as the main contributor to the total L CII. The horizontal straight line at ﹩\mathrm{log}{T}_{\mathrm{gas}}=4﹩ is the gas temperature of the interior of H II regions.
Other Images in This Article


Show More
Copyright and Terms & Conditions
© 2022. The Author(s). Published by the American Astronomical Society.
Copyright ©
2025 Astronomy Image Explorer. All Rights Reserved.