Image Details
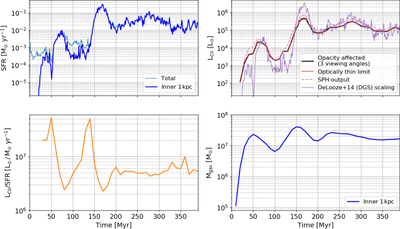
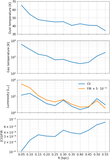
Caption: Figure 2.
Top left panel: SFR vs. time (at a resolution of Δt = 1 Myr) calculated for the entire computational domain (“Total”; thin light-blue line) and for the inner 1 kpc radius (“Inner”; thick dark-blue line). The peaks at ∼ 80 and ∼ 160 Myr correspond to the first and second encounter of the merger, respectively. Top right panel: [C II] luminosity, L CII, vs. time (at a resolution of Δt = 10 Myr). The RADMC-3D opacity-affected calculations (black lines) for three different viewing angles and the corresponding one for the optically thin calculation (red line) are overplotted. The lines are indistinguishable, implying that the optically thin emission is an excellent approximation for L CII. The dashed magenta line is the L CII derived directly from the SPH particles using Equation (3). The thin solid purple line shows L CII scaled using Equation (1) for the De Looze et al. (2014) Dwarf Galaxy Survey (DGS). Bottom left panel: L CII/SFR ratio vs. time (L CII derived directly from the SPH particles and SFR calculated for the inner 1 kpc and averaged over the preceding 5 Myr). The ratio decreases during both merging processes and fluctuates within one order of magnitude, contrary to the span of three orders of magnitude of both L CII and SFR. Bottom right panel: gas mass vs. time (at a resolution of Δt = 10 Myr) for the inner 1 kpc.
Other Images in This Article

Show More
Copyright and Terms & Conditions
© 2022. The Author(s). Published by the American Astronomical Society.