Image Details
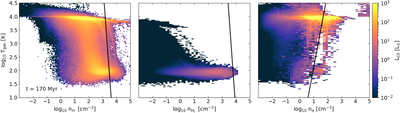
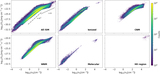
Caption: Figure 6.
Phase plots of T gas vs. the number density of the three C+ colliding partners for the t = 170 Myr snapshot (see also Figure 5). Here L CII is weighted with the abundance of each colliding partner. From left to right, each panel shows the number densities of atomic hydrogen (H I), molecular hydrogen (H2), and electrons (e). The black solid lines correspond to the critical density of each partner vs. T gas (Goldsmith et al. 2012). We find that collisional de-excitation is negligible.
Other Images in This Article


Show More
Copyright and Terms & Conditions
© 2022. The Author(s). Published by the American Astronomical Society.
Copyright ©
2025 Astronomy Image Explorer. All Rights Reserved.