Image Details
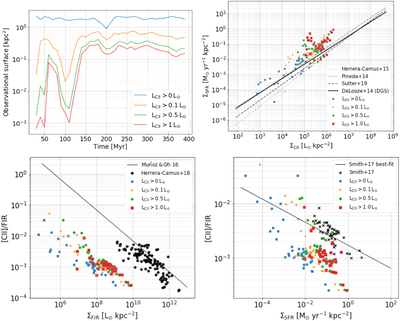
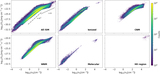
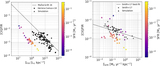
Caption: Figure 17.
Effect of choosing different lower observational limit for L CII. Top left: time evolution of the observational surface for the four different L CII lower limits considered. Top right: the ΣSFR − ΣCII relation. Bottom left: the [C II]/FIR ratio vs. ΣFIR. Bottom right: the [C II]/FIR ratio vs. ΣSFR. In all panels, the blue color is for L CII > 0 L ⊙, orange for L CII > 0.1 L ⊙, green for L CII > 0.5 L ⊙ (the one we consider in the main text), and red for L CII > 1 L ⊙. As can be seen, the observational limit does not affect the trends and the overall results presented.
Other Images in This Article


Show More
Copyright and Terms & Conditions
© 2022. The Author(s). Published by the American Astronomical Society.