Image Details
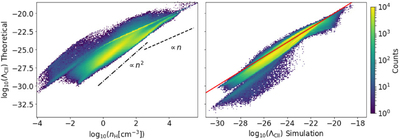
Caption: Figure 15.
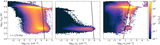
Left panel: correlation of the theoretical ΛCII function (Equation (C11)) vs. n H. The ∝ n H and ﹩\propto {n}_{{\rm{H}}}^{2}﹩ relations are plotted for comparison. Right panel: theoretical vs. simulation C II cooling. The red solid line is the y = x function to guide the eye. As can be seen, the majority of the ΛCII function is well reproduced following the analytical expressions discussed in Appendix C.
Other Images in This Article


Show More
Copyright and Terms & Conditions
© 2022. The Author(s). Published by the American Astronomical Society.
Copyright ©
2025 Astronomy Image Explorer. All Rights Reserved.