Image Details
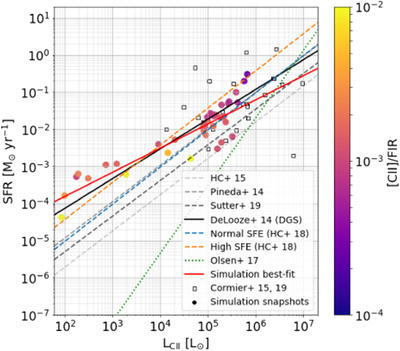
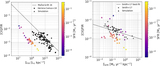
Caption: Figure 13.
Comparison of simulation snapshots (circles) with observations in the L CII − SFR. The snapshots are color-coded with the [C II]/FIR ratio. The red solid line is the best-fit from our simulation snapshots. Black and gray dashed lines represent different best-fitting relations by Herrera-Camus et al. (2015; HC+ 15), Pineda et al. (2014), and Sutter et al. (2019). From the De Looze et al. (2014) study, we plot the relation from the DGS with a solid line. Furthermore, we plot the best-fit relations of galaxies with normal (blue dashed) and high (orange dashed) star formation efficiencies discussed in Herrera-Camus et al. (2018; HC+ 18). In addition, we plot individual observations from the DGS by Cormier et al. (2015, 2019) with open black squares and the best-fitting relation from the Olsen et al. (2017) simulations with a green solid line. We find that our simulations are in agreement with the Cormier et al. (2015, 2019) observations and with the De Looze et al. (2014) DGS slope. The medium becomes [C II] deficient as SFR, and therefore L CII, increases.
Other Images in This Article


Show More
Copyright and Terms & Conditions
© 2022. The Author(s). Published by the American Astronomical Society.