Image Details
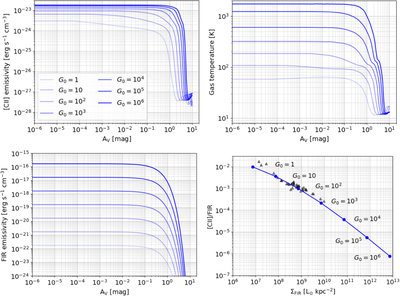
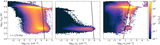
Caption: Figure 11.
PDR simulation of an n H = 300 cm−3 total number density interacting with various FUV intensities in the range G 0 = 1 − 106. Top left: emissivity of [C II] vs. the visual extinction, A V . As G 0 increases, [C II] emissivity increases from ∼6.5 × 10⁻²⁴ erg s−1 cm−3 to ∼1.7 × 10⁻²³ erg s−1 cm−3, at which point it saturates, approaching asymptotically a maximum value. Bottom left: emissivity of FIR calculated assuming that the total dust cooling is equal to radiative dust heating (Equation (8)), vs. A V . Under the optically thin assumption, the FIR emission is given by integrating Equation (8) along the line of sight. Top right: gas temperature vs. A V when thermal balance has been reached. The temperature at the surface of the PDR increases from ∼120 K to ∼1.6 × 10³ K as G 0 increases. Bottom right: [C II]/FIR vs. ΣFIR assuming optically thin emission. Due to the thermal saturation of the [C II] emissivity, the ratio [C II]/FIR decreases for G 0 > 10 in these simulations, leading to a [C II] deficit medium. The gray triangles represent the simulation data as discussed in Figure 8.
Other Images in This Article


Show More
Copyright and Terms & Conditions
© 2022. The Author(s). Published by the American Astronomical Society.