Image Details
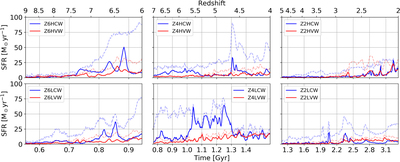
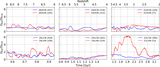
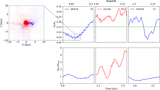
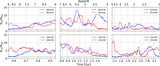
Caption: Figure 13.
Evolution of SFR for stellar bars (thick solid lines) and galaxies (weak dashed lines). The SFR has been calculated based on time intervals of 1 Myr. The VW models are given by the red lines, and CW models by the blue lines.
Other Images in This Article

Show More
Copyright and Terms & Conditions
© 2022. The Author(s). Published by the American Astronomical Society.
Copyright ©
2025 Astronomy Image Explorer. All Rights Reserved.