Image Details
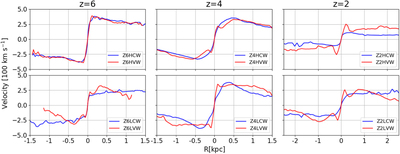
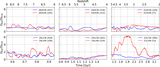
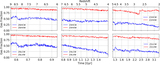
Caption: Figure 2.
Rotation curves of sample galaxies at the final redshifts, z f = 6, 4, and 2, in physical coordinates. The CW models (blue lines) display very similar rotation curves to those of VW models, despite that the latter have larger gas fractions. Note that the top row here and in other figures represents galaxies in the high-overdensity regions, while the bottom row displays galaxies in the low-overdensity regions.
Other Images in This Article

Show More
Copyright and Terms & Conditions
© 2022. The Author(s). Published by the American Astronomical Society.
Copyright ©
2025 Astronomy Image Explorer. All Rights Reserved.