Image Details
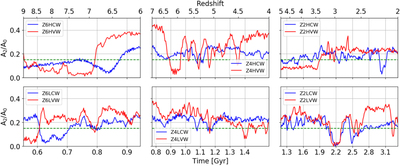
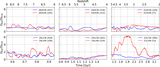
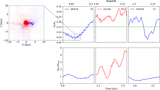
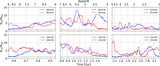
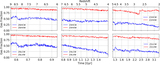
Caption: Figure 3.
Evolution of normalized Fourier amplitude, A 2, of stellar bars by the monopole term, A 0, for the sample galaxies describing the evolution of the bar strength. The VW models are given by the red lines, and CW models by the blue lines. The green dashed lines represent A 2/A 0 = 0.15, which is the border line between bars and oval distortions.
Other Images in This Article
Show More
Copyright and Terms & Conditions
© 2022. The Author(s). Published by the American Astronomical Society.
Copyright ©
2025 Astronomy Image Explorer. All Rights Reserved.