Image Details
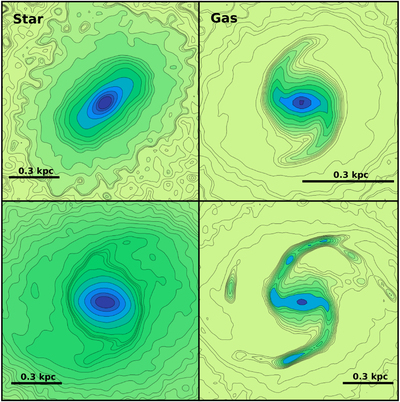
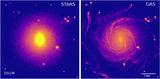
Caption: Figure 5.
Examples of face-on stellar bars and their gaseous components. Contours represent the stellar or gaseous surface density and are logarithmically spaced. Stellar bars are shown on the left, and the gaseous ones are on the right. Left (top to bottom): Z2HVW at z = 4.35 with characteristic boxy shapes of outer contours extending to the UHR (see text); Z4HCW at z = 4.36 with characteristic oval shapes of contours. Right (top to bottom): Z4HCW at z = 6.7; Z4HCW at z = 4.46.
Other Images in This Article

Show More
Copyright and Terms & Conditions
© 2022. The Author(s). Published by the American Astronomical Society.
Copyright ©
2025 Astronomy Image Explorer. All Rights Reserved.