Image Details
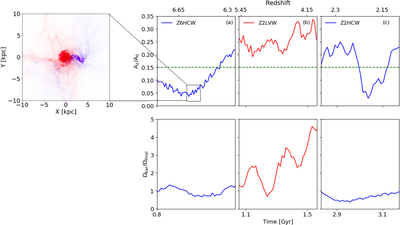
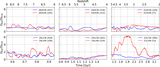
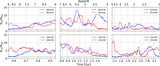
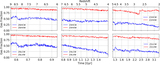
Caption: Figure 8.
Three examples aimed at specific galaxy interactions: shown is evolution of the bar amplitude (top panels) and the bar pattern speed (bottom panels). The dashed line at A 2/A 0 = 0.15 separates between the bar and the oval distortion. (a) Model Z6HCW during asymmetric gas inflow to the galaxy. This interaction triggers the bar and gradually speeds it up. The inset displays the prograde (red; the galaxy) and retrograde (blue; the inflow) velocities of the gas at z ∼ 6.55. (b) Model Z2LVW series of three prograde and nearly coplanar minor mergers. These interactions increase the bar strength and its pattern speed. (c) Model Z2HCW retrograde major merger that destroys the bar, which is later triggered anew.
Other Images in This Article

Show More
Copyright and Terms & Conditions
© 2022. The Author(s). Published by the American Astronomical Society.