Image Details
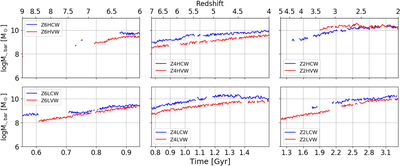
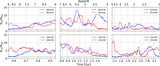
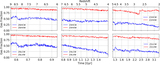
Caption: Figure 4.
Evolution of stellar bar masses for modeled galaxies. The VW models are given by the red lines, and CW models by the blue lines. Only time periods when the bars exist, i.e., A 2/A 0 ≳ 0.15 in Figure 3, are shown here. The gaps correspond to the bar dissolution times.
Other Images in This Article

Show More
Copyright and Terms & Conditions
© 2022. The Author(s). Published by the American Astronomical Society.
Copyright ©
2025 Astronomy Image Explorer. All Rights Reserved.