Image Details
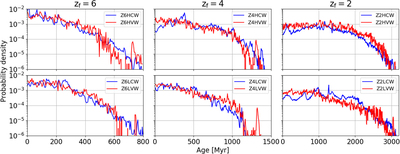
Caption: Figure 12.
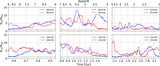
The pdf of stellar ages in bars. The time shown is the stellar age for each model with respect to z f . The curves have been normalized by the total number of stars in the parent galaxies at z f . The ages were divided into bins of 5 Myr. The VW models are given by the red lines, and CW models by the blue lines.
Other Images in This Article

Show More
Copyright and Terms & Conditions
© 2022. The Author(s). Published by the American Astronomical Society.
Copyright ©
2025 Astronomy Image Explorer. All Rights Reserved.