Image Details

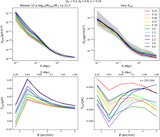
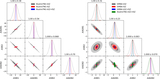
Caption: Figure 7.
This figure shows simulated CAMELS kSZ (left) and tSZ (right) profiles of the CAMELS-IllustrisTNG suite varying A SN2 compared to observed profiles from ACT and profiles from the original IllustrisTNG simulation. The ACT data and errors at 150 GHz presented in Amodeo et al. (2021) and Schaan et al. (2021) are shown in black, along with the profiles from the original IllustrisTNG simulation shown in red. The dotted lines show the original profiles computed from the CAMELS simulations, and the solid lines show the original profiles rescaled to account for differences in simulation volumes, described in Section 3.2. The dashed blue and green curves show the best-fit profile derived by the CMASS emulator for CAMELS-IllustrisTNG and CAMELS-SIMBA, respectively, and demonstrate that the simulations underpredict the observations for any combination of parameters within the range explored by the CAMELS simulations. We note that the selection to show the A SN2 parameter was simply an illustration of the comparison between the simulations and observations, and this figure could be made with profiles varying any of the other feedback parameters to show similar results.
Other Images in This Article
Copyright and Terms & Conditions
© 2022. The Author(s). Published by the American Astronomical Society.