Image Details
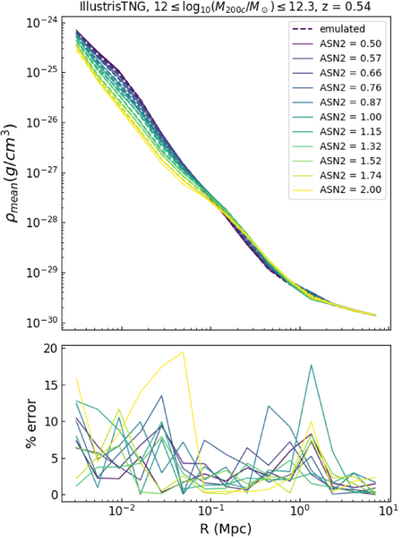
Caption: Figure 2.
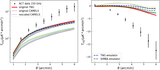
This figure shows an example of the emulator accuracy for mean density profiles of the CAMELS-IllustrisTNG suite, varying the feedback parameter A SN2 at redshift z = 0.54. In the top panel, the profiles taken from the simulations are shown as solid curves, and the different colors represent a different A SN2 value, described in the legend. The emulator prediction for each value is shown as the dashed curves of the same color. The bottom panel shows the percent error for each emulated feedback value as a function of radius, showing that for this particular sample, we are able to achieve accuracies of ≲10% for most of the radial range. We note that the CAMELS suite, mass range, redshift, and feedback parameter variation shown in this figure are chosen only to demonstrate an example of the emulator accuracy and could be made for any other combination of these selections.
Other Images in This Article
Copyright and Terms & Conditions
© 2022. The Author(s). Published by the American Astronomical Society.