Image Details
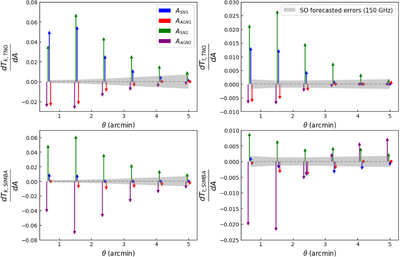
Caption: Figure 4.
This figure shows the derivatives for each parameter at A = 1.0 by the colored arrows for kSZ (left) and tSZ (right) profiles of CAMELS-IllustrisTNG (top row) and CAMELS-SIMBA (bottom row). Positive arrows indicate that an increase in that particular feedback parameter leads to an increase in amplitude of the profile at that particular radial point. Small derivatives are indicated by a hexagonal point close to zero, and the gray error band in each panel shows the forecasted SO errors of the profiles. This figure shows that the emulator for each suite and profile type is sensitive to changes in each of the parameters differently, leading to the different levels of constraint we are able to achieve.
Other Images in This Article
Copyright and Terms & Conditions
© 2022. The Author(s). Published by the American Astronomical Society.