Image Details
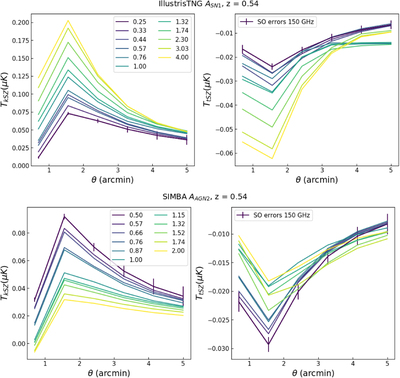
Caption: Figure 3.
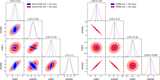
This figure shows kSZ (left) and tSZ (right) projections varying feedback parameters for the CAMELS-IllustrisTNG suite (top, varying A SN1) and the CAMELS-SIMBA suite (bottom, varying A AGN2). The profiles have been weighted to match the mass distribution of the CMASS sample. The limits are shown in Table 1 and the process is described in Section 2.4. The forecasted SO error bars are shown in purple in each panel (see Section 2.4), indicating that with this level of sensitivity, we will be able to differentiate and constrain these models.
Other Images in This Article
Copyright and Terms & Conditions
© 2022. The Author(s). Published by the American Astronomical Society.
Copyright ©
2026 Astronomy Image Explorer. All Rights Reserved.