Image Details
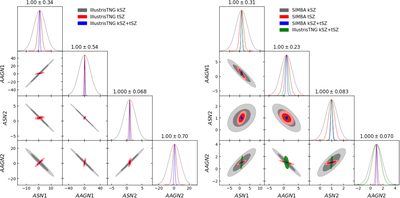
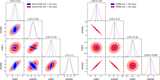
Caption: Figure 5.
Corner plots showing constraints from the CMASS emulator for CAMELS-IllustrisTNG (left) and CAMELS-SIMBA (right). The different colored contours show the constraint for the feedback parameter using only kSZ (gray), only tSZ (red), and the combination of kSZ and tSZ (blue). Since the degeneracies are strong in the left corner plot for CAMELS-IllustrisTNG, we included the combined constraints of CAMELS-IllustrisTNG to the CAMELS-SIMBA corner plot (right panel) to show their combined constraints on the same scale. These profiles and derivatives were calculated using a Gaussian beam, and the ±1σ value of the distribution for each parameter using the combined constraints (blue contours) is shown above each panel on the diagonal and listed in Table 2. We expect that with future observations, we should be able to place constraints within the 10% level on these subgrid models.
Other Images in This Article
Copyright and Terms & Conditions
© 2022. The Author(s). Published by the American Astronomical Society.