Image Details
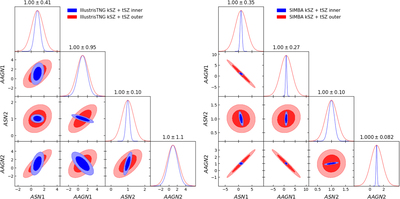
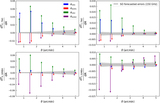
Caption: Figure 6.
Corner plots showing constraints from the CMASS emulator for CAMELS-IllustrisTNG (left) and CAMELS-SIMBA (right) for the different radial components of the profiles, as discussed in Section 3.1.2. The blue contours show the forecasted constraints of the feedback parameter using the inner profile (inward of 3′), and the red contours show the forecasted constraints using the outer profile. These profiles and derivatives were calculated using a Gaussian beam, and the ± 1σ value of the distribution for each parameter is shown above each panel on the diagonal and is listed in Table 2. It can be seen from all panels that the inner profile provides tighter contraints than the outer profile, which is expected due to the smaller error bars.
Other Images in This Article
Copyright and Terms & Conditions
© 2022. The Author(s). Published by the American Astronomical Society.