Image Details
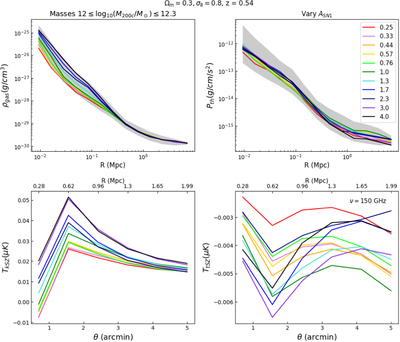
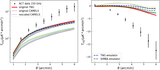
Caption: Figure 1.
This figure shows 3D profiles produced by illstack_CAMELS (top row) and 2D profiles produced by Mop-c-GT (bottom row) for the subset of CAMELS 1P simulations varying the A SN1 feedback parameter of the SIMBA framework. These are median profiles for the mass range ﹩12\leqslant {\mathrm{log}}_{10}({M}_{200c}/{M}_{\odot })\leqslant 12.3﹩ at redshift z = 0.54, and the gray band shows the 1σ distribution of values for one of the profiles. The corresponding radius values in megaparsec are shown on the top axes of the bottom row for straightforward comparison. The values for the A SN1 parameter are shown in the legend, with a value of 1.0 being the same amount of feedback as in the original SIMBA simulation. Differences can clearly be seen in all the profiles due to the variation of this particular subgrid parameter. We note that the CAMELS suite, mass range, redshift, and feedback parameter variation shown in this figure are chosen only to illustrate the profiles we are able to create and analyze, and could be made for any combination of these selections using the data described in the Data Availability section.
Other Images in This Article
Copyright and Terms & Conditions
© 2022. The Author(s). Published by the American Astronomical Society.