Image Details

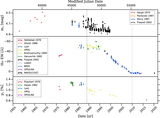
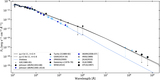
Caption: Figure 16.
Comparison of the observables shown in Figure 1 (black crosses) with the models presented in Figure 14 (colored circles) over the period of disk dissipation. Additional simulated observables for α = 0.1 and α = 1, and the observed polarization position angle intrinsic to the disk, are presented for comparison. The error bars show the 1σ deviation of 10 simulations computed for each model. The color of each model corresponds with the colors used in Figure 14. The vertical gray lines are the same as in Figure 1.
Other Images in This Article

Show More
Copyright and Terms & Conditions
© 2021. The American Astronomical Society. All rights reserved.
Copyright ©
2025 Astronomy Image Explorer. All Rights Reserved.