Image Details
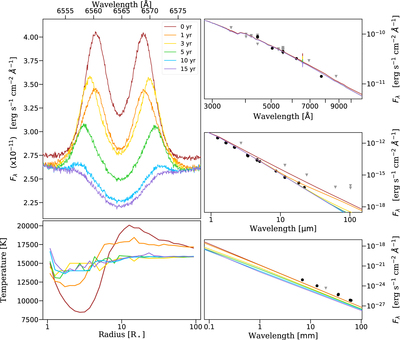
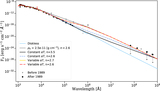
Caption: Figure 9.
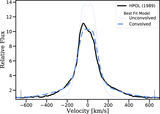
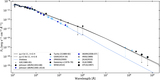
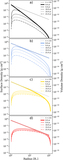
Changes in the Hα line (top left), the disk temperature structure (bottom left) and the visible (top right), IR (middle right), and radio (bottom right) SEDs during the disk dissipation of the constant αT, n = 3.5 model. The Hα spectra are not continuum normalized to clearly show the increase in peak flux during dissipation. The SEDs include observations made before 1989 (gray triangles) and after 1989 (black circles) from Figure 6.
Other Images in This Article

Show More
Copyright and Terms & Conditions
© 2021. The American Astronomical Society. All rights reserved.
Copyright ©
2025 Astronomy Image Explorer. All Rights Reserved.