Image Details
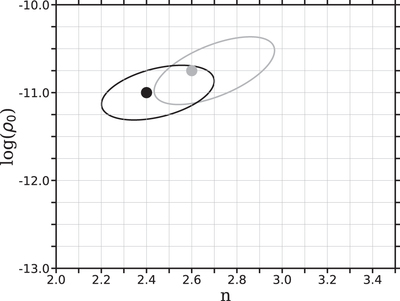
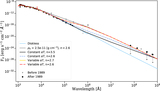
Caption: Figure 7.
Summary of the best-fitting disk densities. Contours corresponding to the 1σ confidence level were determined by interpolation of the ﹩{\chi }_{\nu }^{2}﹩ values over the model grid. The black contours shows the SED fitting and the gray contour shows the Hα fitting, with corresponding colored dots indicating the best-fit model.
Other Images in This Article

Show More
Copyright and Terms & Conditions
© 2021. The American Astronomical Society. All rights reserved.
Copyright ©
2025 Astronomy Image Explorer. All Rights Reserved.