Image Details
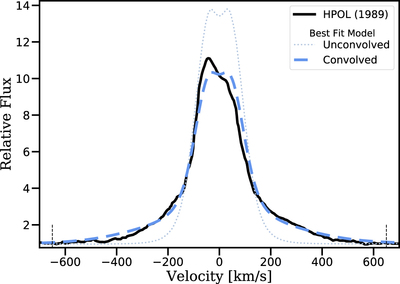
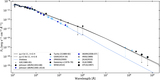
Caption: Figure 4.
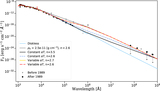
A comparison of the HPOL 1989 Hα profile to the best-fit unconvolved model (dotted, gray) and final convolved spectra (dashed, blue). The vertical dashed lines show the range over which the fit was evaluated.
Other Images in This Article

Show More
Copyright and Terms & Conditions
© 2021. The American Astronomical Society. All rights reserved.
Copyright ©
2025 Astronomy Image Explorer. All Rights Reserved.