Image Details
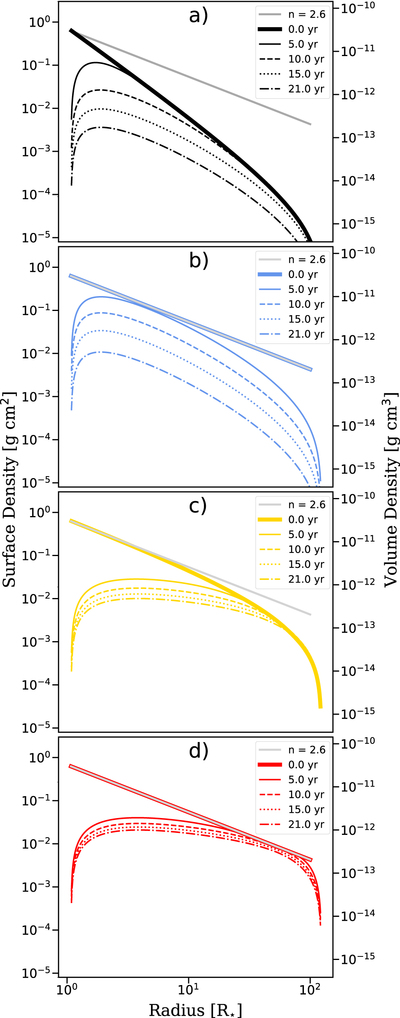
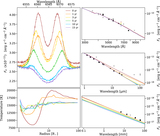
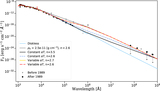
Caption: Figure 8.
Disk density profiles at different times from the start of dissipation for the following scenarios: (a) constant αT, n = 3.5, (b) constant αT, n = 2.6, (c) variable αT, n = 2.7, and (d) variable αT, n = 2.6. A gray line in each panel indicates the best quasi-steady model.
Other Images in This Article

Show More
Copyright and Terms & Conditions
© 2021. The American Astronomical Society. All rights reserved.
Copyright ©
2025 Astronomy Image Explorer. All Rights Reserved.