Image Details
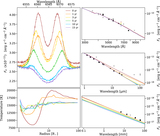
Caption: Figure 1.
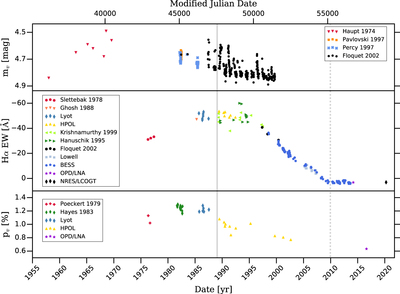
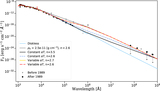
Observations of 66 Oph from 1957 to 2020. Top: V-band photometry. Middle: Hα EW. Bottom: V-band polarization. The sources of the data are listed in the legend; those without dates are previously unpublished. The solid gray vertical line indicates the time for the onset of disk dissipation and the dashed gray vertical line indicates when the Hα line transitioned to absorption. The solid and dashed gray lines also approximately correspond to the periods of observation for IRAS and the Wide-field Infrared Survey Explorer (WISE), respectively.
Other Images in This Article

Show More
Copyright and Terms & Conditions
© 2021. The American Astronomical Society. All rights reserved.
Copyright ©
2025 Astronomy Image Explorer. All Rights Reserved.