Image Details
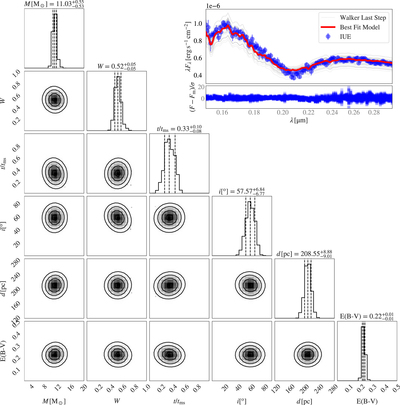
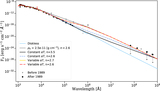
Caption: Figure 3.
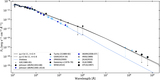
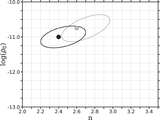
The best-fitting stellar parameters to 66 Oph’s UV spectrum. The probability density functions of each parameter are shown on the main diagonal axis, while the intersection for each parameter shows the correlation map. The six parameters included in the fitting procedure are the stellar mass M, the critical fraction of rotation W, time of life on the main sequence t/tms, stellar inclination i, distance d, and interstellar reddening E(B − V). The subfigure in the top-right corner shows the UV data, the model corresponding to the best-fit parameters, and the predictions from the last step of each walker. The residuals between the data and model are shown directly below this subfigure.
Other Images in This Article

Show More
Copyright and Terms & Conditions
© 2021. The American Astronomical Society. All rights reserved.