Image Details
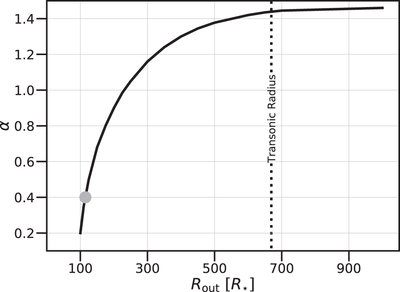
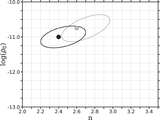
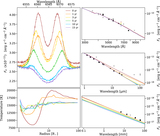
Caption: Figure 13.
Combinations of α and Rout that allow the constant αT, n = 2.6 scenario to lose all Hα emission in 21 yr. The grid of models has been interpolated. The vertical dotted line indicates the transonic radius (Okazaki 2001). The models that best match the observed Hα emission line dissipation are indicated by the point at α = 0.4 and Rout = 115 Req.
Other Images in This Article

Show More
Copyright and Terms & Conditions
© 2021. The American Astronomical Society. All rights reserved.
Copyright ©
2025 Astronomy Image Explorer. All Rights Reserved.