Image Details
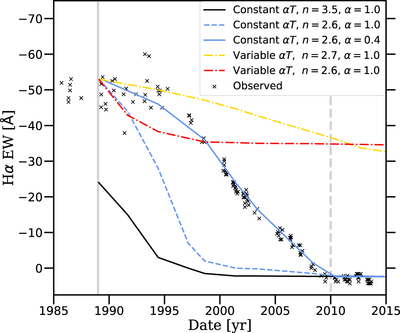
Caption: Figure 12.
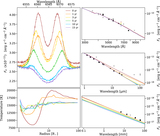
The same as Figure 10 for the Hα EW. The solid vertical gray line indicates the onset of dissipation, and the dashed gray line indicates when the Hα line was observed to transition to absorption. While the model parameters differ, the constant αT, n = 2.6 scenario with α = 0.4 and Rout = 115 Req is shown for comparison. The colors for each model are consistent with those in Figure 8.
Other Images in This Article

Show More
Copyright and Terms & Conditions
© 2021. The American Astronomical Society. All rights reserved.
Copyright ©
2025 Astronomy Image Explorer. All Rights Reserved.