Image Details
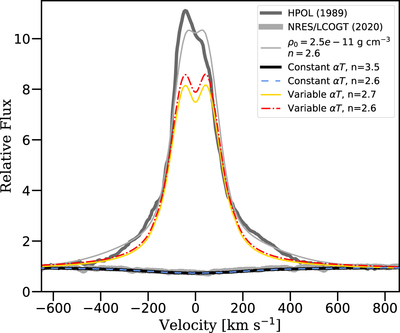
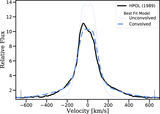
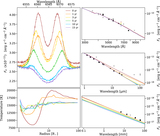
Caption: Figure 11.
The same as Figure 10, but for the Hα line profile. The simulated lines were convolved using the Gaussian determined to give the best fit in Figure 4. The models from the constant αT, n = 3.5 and n = 2.6 scenarios lie on top of the NRES/LCOGT 2020 observation and in absorption. The colors for each model are consistent with those in Figure 8.
Other Images in This Article

Show More
Copyright and Terms & Conditions
© 2021. The American Astronomical Society. All rights reserved.
Copyright ©
2025 Astronomy Image Explorer. All Rights Reserved.