Image Details
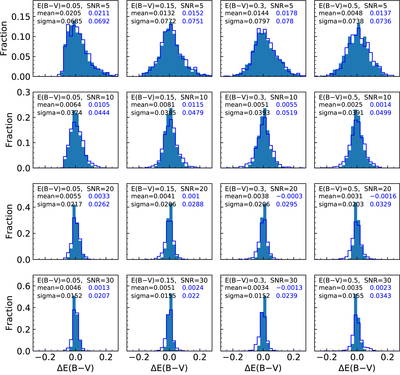
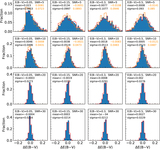
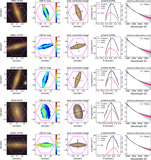
Caption: Figure A2.
Tests on mock spectra generated with continuous SFH, with (open histograms) or without (filled histograms) including emission lines. Panels from left to right correspond to different E(B − V), and panels from top to bottom correspond to different S/Ns, as indicated. In each panel, the histograms show the distribution of the difference between the output and input value of E(B − V), referred to as ΔE(B − V). Indicated in each panel are the mean value and standard deviation of ΔE(B − V) for both the filled (black) and open (blue) histograms.
Other Images in This Article

Show More
Copyright and Terms & Conditions
© 2020. The Author(s). Published by the American Astronomical Society.
Copyright ©
2025 Astronomy Image Explorer. All Rights Reserved.