Image Details
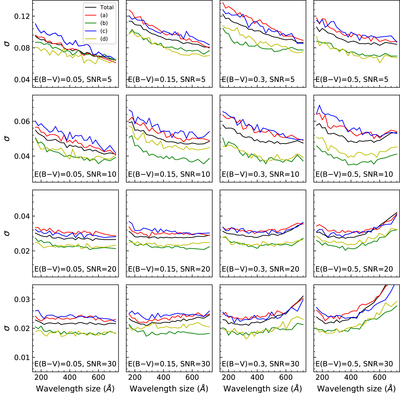
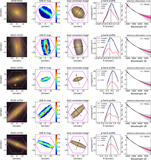
Caption: Figure 6.
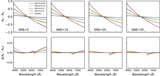
Tests on the effects of the wavelength window size used to define the small- and large-scale components of spectra. Here the standard deviation (σ) of the difference between the output and input E(B − V) values is plotted against the wavelength window size. In each panel, the input value of E(B − V) and the S/N are indicated. The red, green, blue, and yellow lines correspond to spectra in the (a)–(d) regions, respectively. The black line is the result for all the spectra in the four regions.
Other Images in This Article

Show More
Copyright and Terms & Conditions
© 2020. The Author(s). Published by the American Astronomical Society.
Copyright ©
2025 Astronomy Image Explorer. All Rights Reserved.